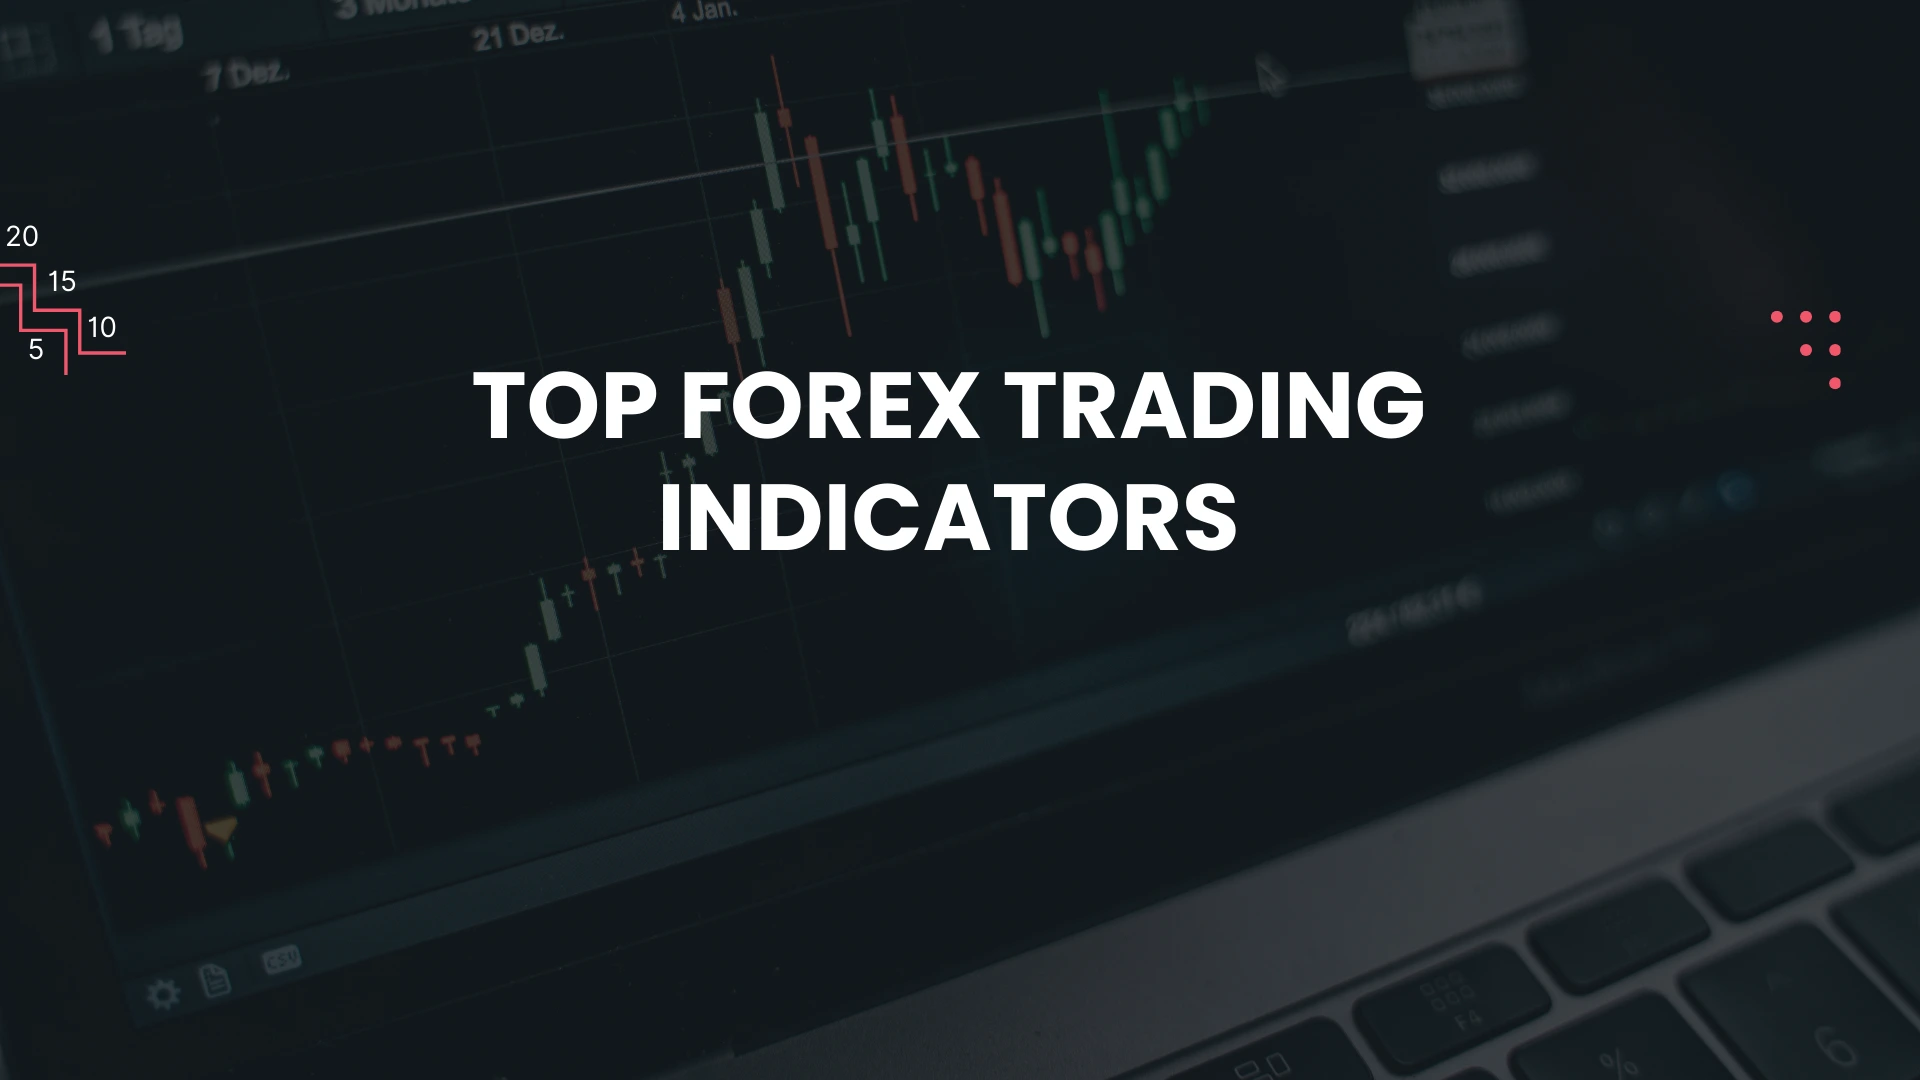
Master technical analysis with our comprehensive guide to the best Forex trading indicators. Learn how to identify trends, measure momentum, and find optimal entry and exit points.
What Are Forex Trading Indicators? Leading vs. Lagging
Forex trading indicators are mathematical calculations based on a currency pair’s price and/or volume. Plotted on a chart, they help traders identify trends, measure momentum, gauge market volatility, find overbought and oversold conditions, and generate trading signals for optimal entry and exit points.
Leading Indicators
- Attempt to predict future price movements
- Examples: RSI, Stochastic Oscillator
- Ideal for identifying potential reversals
- Can generate false signals in ranging markets
Lagging Indicators
- Confirm trends after they’ve begun
- Examples: Moving Average, MACD
- Excellent for trend-following strategies
- May provide late entries in fast markets
The Top 20 Forex Trading Indicators You Need to Know
Here are the best indicators for Forex, categorized by their primary function to help you understand price action and build a profitable trading system.
Trend-Following Indicators
These lagging indicators help you identify and ride the market’s direction, essential for trend-following indicators strategies.
| Indicator | Purpose | Best For |
|---|---|---|
| Moving Average (MA) / Simple Moving Average (SMA) | Smooths out price data to reveal the underlying trend | Identifying trend direction and dynamic support/resistance |
| Exponential Moving Average (EMA) | Similar to SMA but gives more weight to recent prices | Faster response to price changes; crossover strategies |
| MACD (Moving Average Convergence Divergence) | Measures the relationship between two EMAs | Identifying trend changes, momentum, and entry points |
| Parabolic SAR | Places dots on a chart indicating potential reversals | Setting trailing stop-loss orders; trend direction |
| Ichimoku Kinko Hyo (Ichimoku Cloud) | Comprehensive system that defines support/resistance | All-in-one trend identification, momentum, and signals |
Momentum Indicators
These leading indicators help determine the speed of price movement and identify potential reversal points in the market.
| Indicator | Purpose | Best For |
|---|---|---|
| RSI (Relative Strength Index) | Measures speed and change of price movements (0-100 scale) | Identifying overbought (70+) and oversold (30-) conditions |
| Stochastic Oscillator | Compares closing price to its price range over time | Spotting potential reversals; overbought/oversold levels |
| Awesome Oscillator (AO) | Measures market momentum using histogram of MAs | Identifying momentum changes and trend strength |
| Momentum Indicator | Measures the rate of change in a security’s price | Confirming trend strength and potential reversals |
Volatility Indicators
These tools measure the rate of price movements, regardless of direction. High market volatility often means larger price swings and trading opportunities.
| Indicator | Purpose | Best For |
|---|---|---|
| Bollinger Bands | Consists of a middle SMA with two outer bands | Identifying overbought/oversold conditions; volatility spikes |
| ATR (Average True Range) | Measures market volatility by calculating price ranges | Setting stop-loss levels based on current volatility |
| Standard Deviation | Statistical measure of price variation from average | Quantifying volatility and potential price movement size |
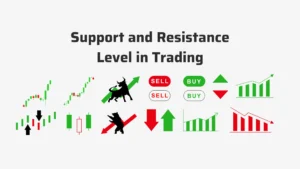
Volume & Support/Resistance Indicators
These tools help confirm price movements and identify key support and resistance levels in the market.
| Indicator | Purpose | Best For |
|---|---|---|
| On-Balance Volume (OBV) | Uses volume flow to predict changes in price | Confirming price trends through volume analysis |
| Fibonacci Retracement | Identifies potential support/resistance levels | Finding retracement levels within larger trends |
| Pivot Points | Calculates potential support/resistance based on previous price | Day trading; identifying intraday support/resistance |
| ADX (Average Directional Index) | Measures trend strength regardless of direction | Determining whether a market is trending or ranging |
Comprehensive Systems
These multi-component indicators provide a complete market view and can form the foundation of a robust trading system.
| Indicator | Purpose | Best For |
|---|---|---|
| Ichimoku Cloud (repeated for emphasis) | All-in-one trend, momentum, and signal system | Comprehensive market analysis in one indicator |
| Supertrend | Provides clear buy/sell signals based on ATR | Trend identification with clear entry/exit signals |
| Zig Zag | Filters out small price movements | Highlighting significant trends and chart patterns |
| Volume Profile | Shows trading activity at specific price levels | Identifying areas of high liquidity and support/resistance |
How to Combine Indicators: Building a Profitable Trading System
Using too many indicators creates confusion—a classic common trading mistake. The key is to combine different types of indicators for confirmation rather than using multiple indicators of the same type.
Trend + Momentum Strategy
- Identify Trend: Use 200 EMA – price above for longs, below for shorts
- Time Entry: Wait for price retracement to key support/resistance
- Confirm Momentum: Use RSI to show oversold (in uptrend) or overbought (in downtrend)
- Manage Risk: Set stop-loss below recent swing low/high
Volatility Breakout System
- Measure Volatility: Use Bollinger Bands – bands contract before expansion
- Confirm Breakout: Wait for price to close outside bands with increased volume
- Filter False Signals: Use ADX above 25 to confirm trend strength
- Set Targets: Use ATR to set realistic profit targets based on volatility
Backtesting Indicators: Before using any strategy live, conduct thorough backtesting on platforms like TradingView or MT5. Forex backtest results for popular strategies like MACD backtest, RSI backtest, or Bollinger Bands backtest will reveal the most profitable indicators and optimal parameters for your trading style.
The Critical Role of Forex Risk Management
No indicator is 100% accurate. Fundamental analysis (like economic news events) can override all technical signals. This is why risk management is non-negotiable for successful Forex trading.
Always Use Stop-Loss
Your primary defense against significant losses. Set your stop-loss based on technical levels or volatility (using ATR).
Risk Percentage Rule
Never risk more than 1-2% of your account on a single trade. This protects your capital during losing streaks.
Proper Position Sizing
Calculate your position size based on your stop-loss distance and risk percentage to ensure consistent risk exposure.
Understand Market Context
Be aware of economic calendars and market events that might increase volatility and impact your trades.
Forex Trading for Beginners: How to Get Started
If you’re new to Forex trading for beginners, follow these steps to begin your trading journey on the right foot:
| Step | Action | Tips |
|---|---|---|
| 1. Education | Learn Forex trading basics | Focus on understanding how to read Forex charts and basic terminology |
| 2. Demo Account | Practice without real money | Most brokers offer demo accounts with virtual funds to test strategies |
| 3. Start Simple | Master 2-3 indicators first | Begin with Moving Average, RSI, and MACD before adding more tools |
| 4. Develop a Plan | Create a trading plan | Define your strategy, risk management rules, and trading schedule |
| 5. Open Live Account | Start with small capital | When ready, open Forex account with a reputable broker and start small |
Common Trading Mistakes to Avoid
Even experienced traders make errors, but being aware of these common trading mistakes can help you avoid them:
Analysis Mistakes
- Using too many indicators (analysis paralysis)
- Ignoring higher time frame trends
- Overlooking fundamental analysis
- Chasing losses with reckless trades
Psychology Mistakes
- Letting emotions drive decisions
- Failing to stick to your trading plan
- Overtrading due to boredom or frustration
- Confirmation bias (seeing only what you want)
Risk Management Mistakes
- Risking too much on single trades
- Not using stop-loss orders
- Moving stop-loss further away when losing
- Adding to losing positions (averaging down)
Recommended Trading Tools & Platforms
To effectively use technical indicators, you need access to robust trading platforms and charting software:
| Platform | Best For | Indicator Support |
|---|---|---|
| MetaTrader 4/5 (MT5) | Comprehensive Forex trading | Extensive built-in indicators, custom indicator support |
| TradingView | Chart analysis and social trading | Massive library of community-built indicators |
| cTrader | Advanced order types and execution | Clean interface with good indicator selection |
| Thinkorswim | U.S. traders, multi-asset trading | Powerful scanning and indicator backtesting |
Key Takeaways
- Forex indicators are powerful tools but should never be used in isolation
- Combine different types of indicators (trend, momentum, volatility) for confirmation
- Always prioritize risk management over potential profits
- Backtest any strategy thoroughly before using it with real capital
- Start with a few indicators and master them before adding complexity