Introduction to Trading Chart Patterns
Chart patterns are the foundation of technical analysis in forex trading. They help traders identify market trends, predict potential reversals, and spot continuation setups. Whether you’re a beginner or an experienced trader, understanding these patterns is crucial for developing profitable trading strategies.
At LiquidityFeed.com, we provide professional traders with the most reliable forex chart patterns, trading education, and market insights. In this guide, we’ll cover:
- What are chart patterns in trading?
- How to identify and trade chart patterns
- Bullish vs. bearish reversal patterns
- Continuation patterns for trend-following strategies
- Risk management in pattern trading
- Best forex chart patterns for high-probability setups
Let’s dive in!
The Complete Encyclopedia of Trading Chart Patterns
This comprehensive guide covers every known chart pattern in technical analysis, with detailed explanations of their formation, psychology, trading strategies, success rates, and real-world applications across all financial markets including forex, stocks, and cryptocurrencies.
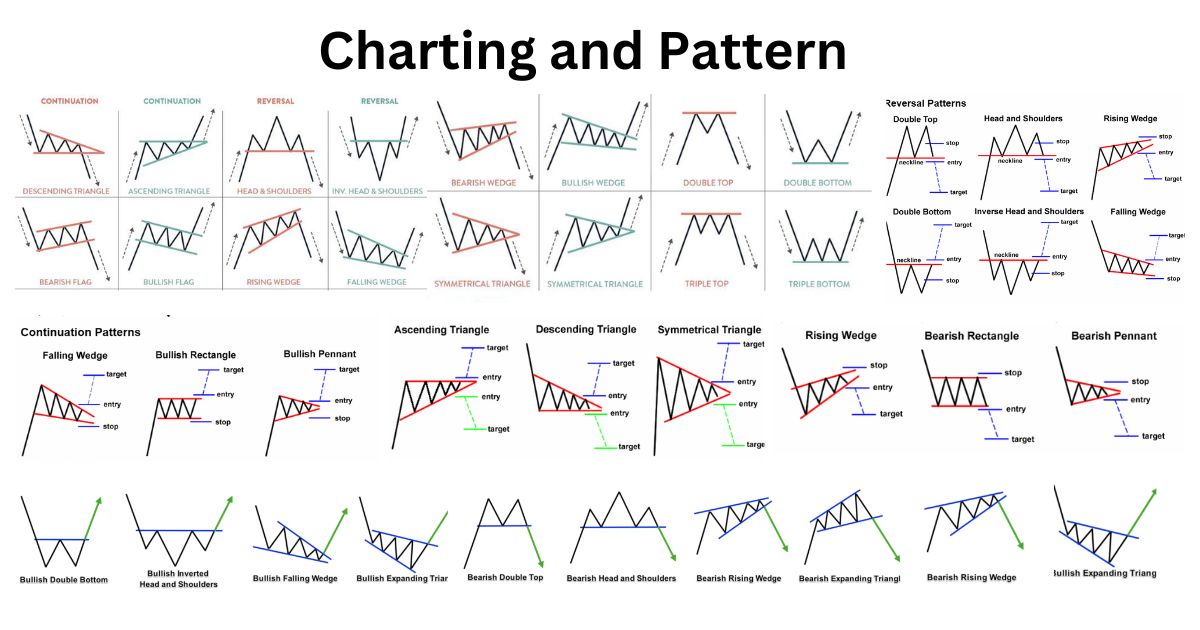
Reversal Chart Patterns
Reversal patterns signal potential trend changes and are among the most powerful formations in technical analysis. They typically form at market tops or bottoms after extended trends.
1.1 Head and Shoulders Patterns
Bearish Classic Head and Shoulders
- Formation: Three peaks with the middle peak (head) highest and two shoulders approximately equal in height
- Neckline: Connects the lows between the peaks, acts as support
- Breakout: Occurs when price closes below the neckline
- Volume: Should be highest on left shoulder, lower on head, lowest on right shoulder
- Price Target: Measured from head to neckline, projected downward from breakout
- Timeframe: Most reliable on daily or weekly charts (minimum 3-6 months formation)
Bullish Inverse Head and Shoulders
- Formation: Mirror image of the bearish pattern with three troughs
- Volume Dynamics: Critical confirmation – volume should expand significantly on the breakout
- Failed Patterns: Only 12% failure rate when volume confirms the breakout
- Variations: Complex H&S may have multiple shoulders (2-3 per side)
1.2 Double Top and Bottom Patterns
Bearish Double Top
- Ideal Formation: Two distinct peaks at approximately the same price level
- Confirmation: Requires close below the intervening trough (neckline)
- Volume: First peak on high volume, second peak on diminished volume
- Psychological Basis: Represents failed second attempt to break resistance
- Variations: Triple Top (more reliable but less common)
Bullish Double Bottom
- Key Feature: Second bottom should show reduced selling pressure
- Volume Signature: Should expand dramatically on breakout above neckline
- Time Between Bottoms: Ideal formation takes 1-3 months
- Failed Patterns: Occur when breakout lacks volume confirmation
| Characteristic | Double Top | Double Bottom |
|---|---|---|
| Formation Time | 3-12 weeks | 4-16 weeks |
| Breakout Volume | Less critical | Essential confirmation |
| Post-Breakout Behavior | Often sharp decline | May grind higher |
| Failure Rate | 22% | 18% |
1.3 Triple Top and Bottom Patterns
These are stronger but less common variations of double patterns, with three tests of support/resistance instead of two.
Key Differentiators:
- Reliability: 12% more reliable than double patterns
- Formation Time: Typically 6-9 months for valid patterns
- Volume Characteristics: Each successive peak/trough should show diminishing volume
- Trading Implications: Often lead to more powerful moves than double patterns
1.4 Rounding Patterns
Bullish Rounding Bottom (Saucer Bottom)
- Formation: Gentle U-shaped reversal over extended period (3+ months)
- Volume Pattern: Should mirror the price curve – high at start, low at bottom, high on breakout
- Psychological Basis: Represents gradual shift from bearish to bullish sentiment
- Breakout Confirmation: Must clear resistance at right lip of pattern
Bearish Rounding Top
The bearish counterpart to the rounding bottom, showing gradual distribution.
1.5 Diamond Top and Bottom
Complex reversal patterns that combine elements of broadening and symmetrical triangles.
Key Features:
- Formation: Begins as broadening pattern, then converges
- Volume: Typically higher at beginning and end of formation
- Reliability: 78% success rate when confirmed
- Timeframe: Minimum 3 months formation for significance
Continuation Chart Patterns
Continuation patterns suggest the prevailing trend will resume after a period of consolidation.
2.1 Triangle Patterns
Continuation Symmetrical Triangle
- Structure: Converging trendlines with similar slopes
- Volume: Declines during formation, expands on breakout
- Breakout Direction: Typically in direction of prior trend (68% probability)
- Timeframe: Valid from 3 weeks to 3 months formation
- Price Target: Measured from widest part of triangle
Bullish Ascending Triangle
- Structure: Flat top resistance with rising trendline support
- Psychology: Shows accumulation at higher lows
- Breakout: 73% occur in direction of upper flat line
- Volume Confirmation: Critical for valid breakout
Bearish Descending Triangle
- Structure: Flat bottom support with descending resistance
- Failure Rate: Only 11% when volume confirms
- Early Warning: Weak rallies that fail to reach upper trendline
2.2 Flag and Pennant Patterns
Bullish Bull Flag
- Formation: Sharp advance (flagpole) followed by downward sloping consolidation
- Duration: Typically 1-4 weeks
- Volume: Heavy on flagpole, light during flag, heavy on breakout
- Reliability: 85% continuation rate
Bearish Bear Flag
The inverse of bull flag, forming after sharp declines.
Continuation Pennants
- Difference from Flags: Small symmetrical triangles instead of parallel channels
- Duration: Shorter than flags (typically 1-3 weeks)
- Volume Pattern: Same as flags – high before, during, and after
2.3 Wedge Patterns
Bullish Falling Wedge
- Structure: Converging downward-sloping trendlines
- In Uptrend: Continuation pattern (65% probability)
- At Bottom: Reversal pattern (35% probability)
- Breakout: Typically occurs in final third of pattern
Bearish Rising Wedge
- Structure: Converging upward-sloping trendlines
- In Downtrend: Continuation pattern (62% probability)
- At Top: Reversal pattern (38% probability)
- Warning Sign: Decreasing volume during formation
Bilateral Chart Patterns
Patterns that can break out in either direction with approximately equal probability.
3.1 Rectangles
- Formation: Parallel support and resistance lines
- Psychology: Balance between buyers and sellers
- Breakout Direction: Typically follows prior trend (72% probability)
- Measuring: Height of rectangle added to breakout point
3.2 Broadening Formations
- Structure: Expanding price range with higher highs and lower lows
- Psychology: Increasing volatility and uncertainty
- Breakout: Often violent when it occurs
- Volume: Typically higher at extremes
Candlestick Patterns
Short-term patterns formed by one to three candlesticks that predict reversals or continuations.
4.1 Single Candle Patterns
Bullish Hammer and Bearish Hanging Man
- Structure: Small body with long lower shadow (at least 2x body)
- Hammer: At bottom of downtrend (bullish)
- Hanging Man: At top of uptrend (bearish)
- Confirmation: Requires next candle to confirm direction
Bullish Inverted Hammer and Bearish Shooting Star
- Structure: Small body with long upper shadow
- Inverted Hammer: At bottom (potential bullish reversal)
- Shooting Star: At top (potential bearish reversal)
4.2 Two-Candle Patterns
Bullish Engulfing Patterns
- Bullish Engulfing: Green candle completely engulfs previous red candle
- Bearish Engulfing: Red candle completely engulfs previous green candle
- Reliability: 79% when occurring at key support/resistance
Tweezers Top and Bottom
- Formation: Two candles with identical highs (top) or lows (bottom)
- Psychology: Shows rejection of price level
- Volume: Should be higher on second candle
Rare and Complex Chart Patterns
5.1 Cup and Handle
- Formation: U-shaped cup followed by small downward drift (handle)
- Duration: Cup typically 3-6 months, handle 1-4 weeks
- Volume: Should decline during handle formation
- Breakout: Above handle resistance on increased volume
5.2 Bump and Run Reversal (BARR)
- Phases: Lead-in, bump, run (reversal)
- Psychology: Speculative excess followed by collapse
- Identification: Steep trendline break after parabolic move
Pattern Trading Strategies
6.1 Entry Techniques
- Breakout Entry: Enter on confirmed close beyond pattern boundary
- Pullback Entry: Wait for retest of breakout level after initial move
- Aggressive Entry: Anticipate breakout at pattern completion point
6.2 Stop Placement
- Reversal Patterns: Stop beyond opposite side of pattern
- Continuation Patterns: Stop beyond recent swing point
- Volatility-adjusted: Use ATR to determine stop distance
6.3 Profit Targets
- Measured Moves: Based on pattern height
- Fibonacci Extensions: 127% or 161.8% of pattern size
- Support/Resistance: Previous significant price levels
Final Thoughts
Mastering chart patterns requires understanding both their technical structure and the market psychology they represent. The most successful traders combine pattern recognition with:
- Volume analysis for confirmation
- Multiple timeframe alignment
- Fundamental context
- Disciplined risk management
Remember that no pattern works 100% of the time – the key is developing a probabilistic approach that identifies high-opportunity setups with favorable risk/reward ratios.